Introduction/Abstract
I’ve always been interested in incorporating education on air pollution in many of my lessons. In fact, my senior project revolved around this very idea. Living Los Angeles area, there are many different neighborhoods that have an extreme amount of air pollution. From highways, industrial zones, and constant construction projects, schools can be exposed to a lot of air pollution. My senior project focused on the effect of air pollution on developing children. The foundation of the project was that by educating students and teachers on the harmful effects of air pollution, we can increase academic performance and decrease the rates of respiratory diseases like asthma. A simple and straightforward way of introducing these concepts is with air quality monitors.
Increasing Academic Performance
It’s been shown in various studies that high levels of air pollution have been correlated to lower cognitive abilities. It’s the reason why when you’re sitting in a room without ventilation for a long time, you can get brain fog. With some classrooms having little or no ventilation or being close to something that produces a lot of pollution like industrial zones, children can be exposed to pretty high levels of pollution during the school day. Obviously, stopping all forms of pollution, especially in an area like Los Angeles, is impossible, it’s still worth while to try to stay aware of pollution levels and start using good safety practices.
Impact on Health
Environmental hazards have always been a hard thing to study and connect with health issues. Many of these hazards them have long term effects that don’t always show up right away. Air pollution however, has been connected with increases in respiratory disease like asthma or bronchitis. The World Health Organization has even stated that in 2019, 4.2 million deaths were attributable to air pollution alone. With this being such a serious problem, I think intervention
What Can We Do?
One of the main things that my project aimed to do was to install air quality monitors in public schools. The thought behind this was that it would give teachers and students a chance to visualize air quality. Ideally, at least one outdoor monitor and one indoor monitor would be installed. I’ve actually been thinking about this idea since before starting my senior project with introducing citizen science projects to schools. As I did more and more research, I came across one organization that stood out against the rest: AirGradient.
AirGradient is a company that gives people resources on building their own air quality monitors including software and guides. What surprised me about AirGradient was that they listed the exact parts their monitors used and gave pretty detailed documentation for free. This meant that, if I wanted to, I could source all the electronic parts myself and create a monitor the exact same way they do without paying them anything. This also means I can change whatever I wanted with the hardware and software if I wanted to. Of course, one of my strong suits isn’t electronics so I opted on buying a monitor from their website with a small and reasonable mark up.
AirGradient for Schools
I actually received my outdoor AirGradient monitor quite a while ago (in December). These last few months, I’ve have been using it to measure the outdoor quality of my home. In January, I especially remember being grateful for the monitor since the Palisades and Eaton fire started blowing a lot of air pollution in my direction. AirGradient has a free dashboard you can use that displays different contaminants very clearly. You can see below a snapshot of one of these displays when the fires began. Unfortunately, you can also see a period of time when internet and electricity were being cut and a gap in the graph (in no way AirGradient’s fault).
If I were able to set something like this up in a school, I would use this time to explain why these fires were so awful and it can explain why certain procedures are in place. Something as simple as “We don’t go outside when the bars on the graph are yellow” can start a conversation on air quality.
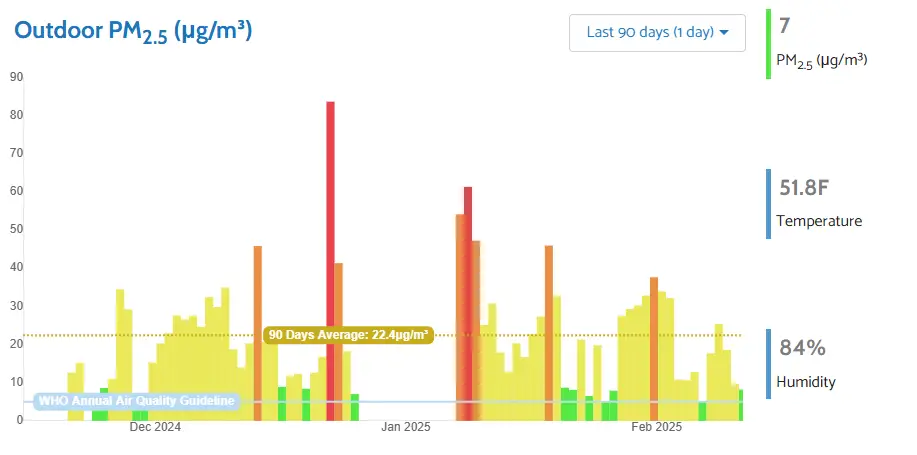
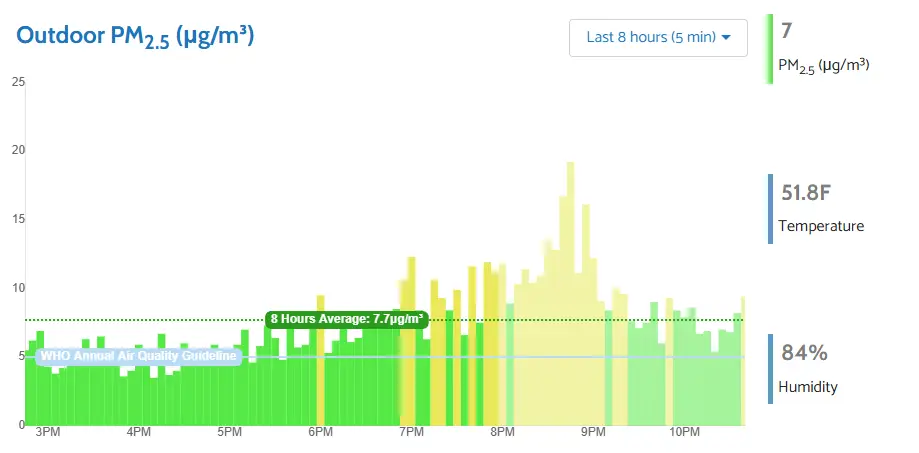
This graph displays exactly what I would want to show in classrooms. Something simple that can be explained to younger students while giving more information to older students who might want to get a better understanding of air pollution. While 90 days could be very useful in a classroom setting, I imagine myself using a graph like the one below, showing air quality from the last 8 hours. You can see obvious spikes at certain times and students can make guesses on why these spikes happen.
Why AirGradient?
I think every reasonably thinking person should be asking why I chose AirGradient. I looked at a couple other air quality monitors but there are a couple reasons why I was drawn to AirGradient. The first is that they connect with more research than any other company selling air quality monitors. In fact, I just took a quick look at their website and found a post on how they supplied monitors to a school project similar to my senior project. Another thing I liked about how AirGradient worked is that you actually never have to use any of their products. Even if you source your own parts, use their software, you don’t actually have to give them any of your information. You can easily connect your monitors to your home systems directly. Other companies usually have information sent from the monitor to their database/servers and then to your device.
This leads me to the reason I liked AirGradient the most, the open source aspect. This ties into my last point but I really liked the idea that the air quality monitors, even if they were bought assembled from their website, could be changed to specific needs. A huge part of my senior project was encouraging older students to become more involved and invested in the projects. I could see a high school student who knew a lot about programming and electronics becoming more involved at this point. Giving people the opportunity to make their own unique contribution is so powerful and AirGradient lets people do that.
Of course, nothing is perfect and I’m sure even AirGradient themselves would agree that there’s room for improvement. I think they have done a great job at creating a simple UI for the every day user. I even think these monitors would be great for my idea in schools. However, I have been struggling a little bit connecting it to anything I can share real time data. I would love to have a display on this page that shows real time date in graph form. I can and will continue to work on this and will add it below but for now, I haven’t been able to find a way.
Conclusion
Even though I talked a lot about AirGradient, I think the main point I tried to make was the importance of education. It doesn’t matter which air quality monitor you use. I think I could even argue that it doesn’t have to be super accurate. As long as it can show trends in air quality, it can be a great tool for teaching about the environment. If these classes are offered, they’re usually only offered in high school. Even by just having the graph shown in school for students to ask questions on, it could make a huge impact. Something as small as an air quality monitor can start the conversation of air quality. Whether you’re a teacher, parent, or nanny, if you’re in a position to start introducing kids to the importance of air quality, I encourage you to do so.